
Puzzle Nekst 2 2014-2015
Even though it is currently time for the Christmas holidays, most of us Econometrics students spend their time studying for the upcoming exams. If you feel like you have had enough of Dijkstra’s algorithm, AIMMS, or Maximum Likelihood Estimators, then go ahead and try to solve this puzzle!
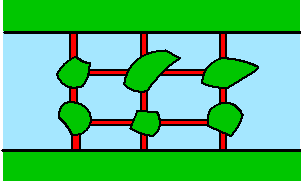
Far, far away in the kingdom of The Matherlands lies a city called Tilburg. This city actually consists of two riversides, called Tilburg-North and Tilburg-South, with six small islands lying in the river. All these islands and shores are connected with each other via thirteen bridges, as shown in the picture.
One of Tilburg-North’s inhabitants, Henk, has to hand in his philosophy paper on the next day in Tilburg-South. That night however, a big storm passes over the islands and every single bridge has a probability of ½ to collapse. Now the question is: what is the probability that Henk will still be able to hand in his paper, meaning that he will have to find a path over the bridges from Tilburg-North to Tilburg-South?
Please send your solution to Nekst@Asset-Econometrics.nl before the 13h of March. A crate of beer or a delicious pie, whichever the winner prefers, will be waiting for whoever has the best (partial) solution. Please note that as before, every recipient of this magazine is eligible to send in their solution, so members of the department are invited to participate as well. Good luck!
Miriam Loois is the winner of the previous puzzle. As a reward, he can come and pick up a crate of beer or a pie at room E1.10. The solution of the previous puzzle was fifty minutes.
Explanation Puzzle Nekst 1 2014-2015
One way to solve this puzzle, is by naming the vertices of the cube A, B, C, D, E, F, G and H, as you can see in the figure. We also give them a corresponding color: blue, green, red or purple in the following way. The ant starts from the red vertex A, which means that he will be certainly be on a blue vertex after five minute. From such a blue vertex, he can visit either a green or a red vertex. Now from a greet vertex, he can visit either a blue vertex or a purple one (which equals getting eaten by the spider). Hence we look at vertices which are in the same state and not so much at the vertices themselves.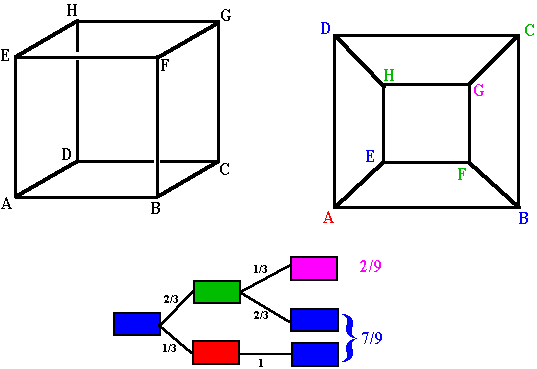
With this scheme in mind, we can create a probabilistic tree. In this table you can see the total amount of steps, with their corresponding probabilities, of getting from a blue vertex to a purple one.
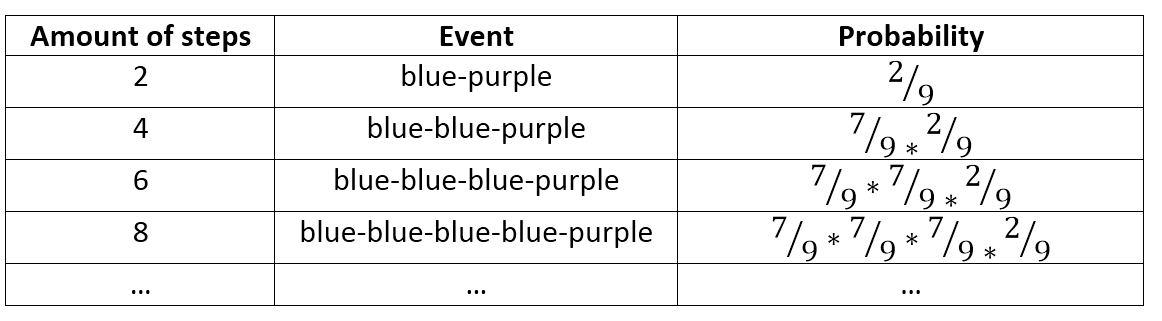
We now see that if our beloved ant is positioned on a blue vertex, he has a probability of 7/9 to be on a blue vertex after ten minutes and he has a probability of 2/9 to be eaten after 10 minutes. Therefore, the expected amount of steps S the ant takes before reaching the spider can be written in the following way: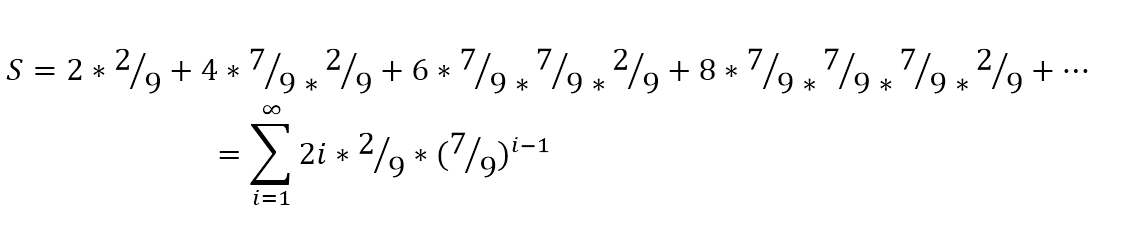
When solving this equation we find that S equals 9, which means that it takes our ant an average of nine steps to move from a blue tot a purple state. As the ant starts from a red state, it takes him an average of ten steps to move from red vertex A to purple vertex H, where ten steps correspond to a time-lapse of 50 minutes. Henceforth, the expected amount of time the ant will still be alive is 50 minutes (10 steps).


