

Surviving the Retail Market
Even within the largest retail corporations, members of the board have different points of focus. A lack of focus within the board leads to an unclear market proposition and a loss in revenues. To overcome this problem a data-driven approach to the marketing strategy can enable decision making. The data-driven approach will contribute to a single language among the entire organization upon which decisions can be based.
In the Netherlands numerous retailers are located in shopping and city centers. However, more and more retailers fail to stay in business. Recently V&D has been declared bankrupt. Also Miss Etam failed to be relevant to their customers and had to close their stores. Just a few weeks ago another retailer has entered troubled water, Unlimited Sports Group can no longer pay their bills. The underlying reason for each of these bankruptcies is the lack of differentiation from the competition. These retailers fail to bring value to the customers in a way Starbucks and IKEA do. A segment in which the margins are especially small is the grocery market. Here, the retailers earn their money due to a large customer base, not a high profit margin. This is due to the ever ongoing price war. The first price war lasted from 2003 until 2006. Later in 2008 and again in 2011 there were price wars amongst supermarkets. Though it is less visible today, supermarkets are still competing on price, reducing the margins to a minimum. The choice to battle on the field of price is remarkable because supermarkets have so much more to differentiate on. One could think of their products, service and accessibility. In order to attract customers to your supermarket you must improve every year. According to Levy et al. (2014) [1], 33% of the customers changed their supermarket in 2013. Of these customers 43% changed due to price, while 25% changed due to long lines, poor selection and low quality. Rude employees were responsible for 17% of the changing customers and crowded stores for the remaining 14%.
Theory
When starting any company, especially a retail store, the manager needs to go through some steps to increase the chance of success. First, the retailer decides on the target market. Second is choosing the correct retail mix, according to Ghosh (1990) [2]. The Costumer Relevancy Theory states that customers search for the retail mix that suits them best. The retail mix is a combination of marketing activities by which the retailer creates value for the customer. According to Ghosh the basic elements are:
- location;
- merchandise;
- store atmosphere;
- customer service;
- price;
- advertising;
- personal selling;
- sales incentive programs.
To find the right element to excel in, in order to outmarch the competition, Capgemini Consulting has developed the Customer Relevancy Model. Earlier research conducted among 16,000 consumers across nine countries by Capgemini has proven that the customer values only five attributes in every business interaction, resulting in the Customer Relevancy Model. This tool enables one to think and to make decisions on management level for a distinctive market positioning. Furthermore, it is widely used to talk in the same wordings across all layers of the organization on the level of brand, portfolios, customer segments, and products or services. Also proven by earlier research is that all successful companies have a clear customer experience strategy: dominating on one attribute, differentiating on another and parity on the rest. Or, on a five point Likert scale: score a five on one attribute, a four on another and a three on the rest. The model is visually expressed in Figure 1 for a company dominating on service and differentiating on price.
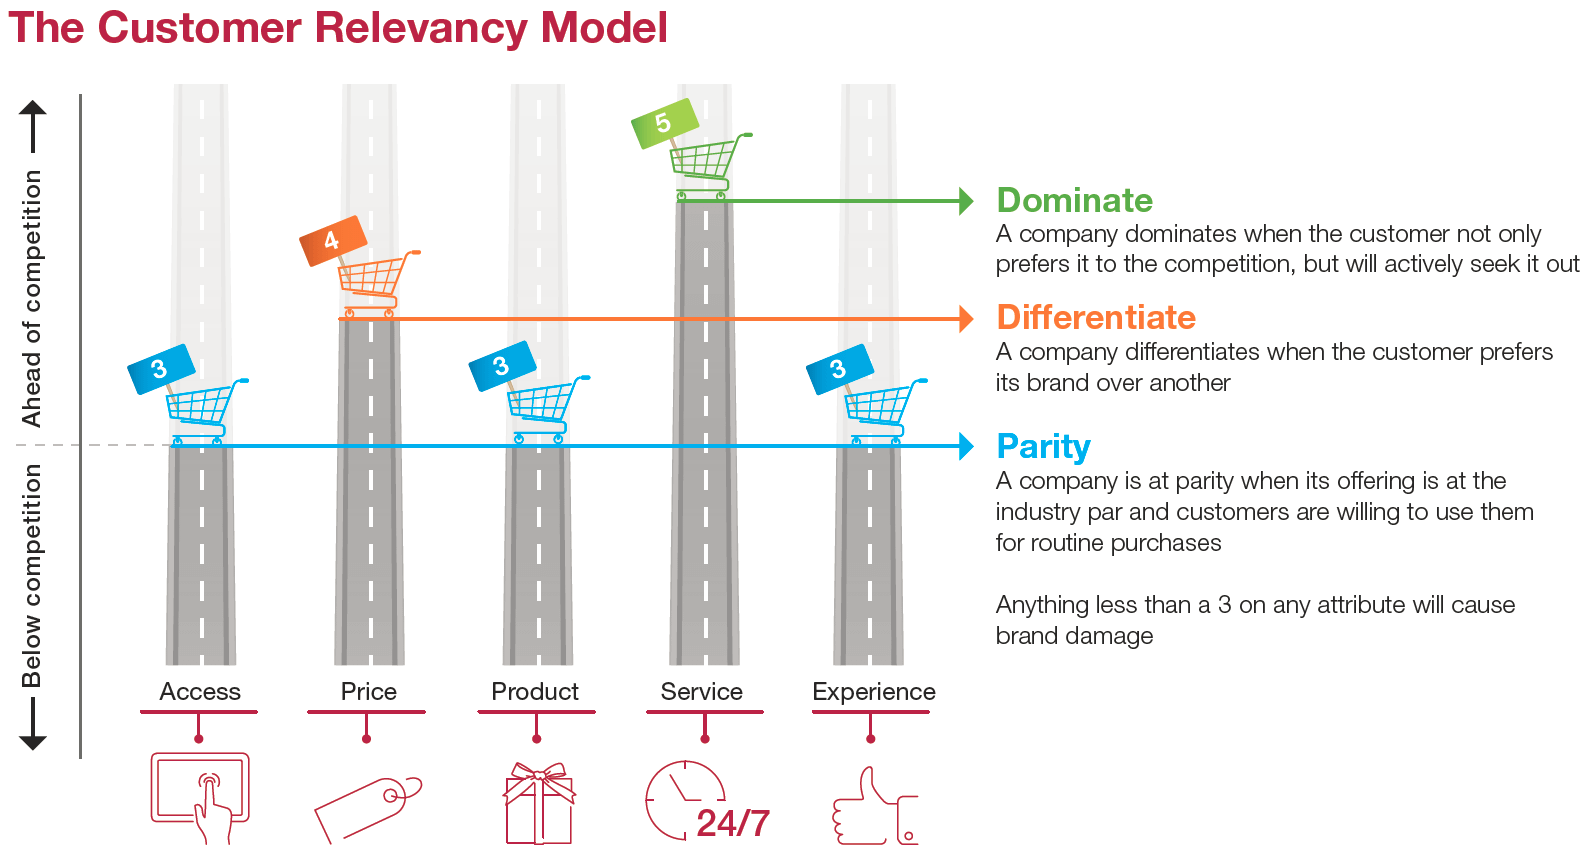
The observant reader might have noticed that the translation from words to numbers makes the model invalid. When each company in a market would obey the Customer Relevancy Model, parity would increase as no company can afford to be below parity. Therefore, it is important to note that the numeric expression for the levels of the model attributes are used to spread understanding.
The model is already, knowingly or unknowingly, widely used by companies around the world. However, until now it is unclear to companies whether they excel or differentiate and which attributes are truly valued by the customers.
Data
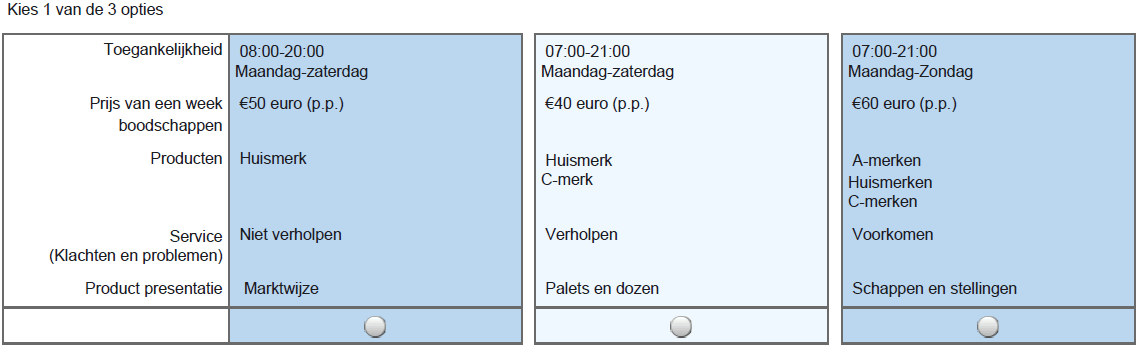
To find the preferred attributes and their corresponding levels, a survey among 387 Dutch customers has been conducted. The respondents stated their personal characteristics such as gender, age, income, education, household size, occupation, and role in the household. Furthermore, their shopping behavior was investigated. The questionnaire asked about the used supermarkets and the percentage of the household budget spent in that supermarket. Hereafter, the supermarkets are rated, based on the five Customer Relevancy Attributes: access, price, product, service and experience. The last part of the survey contains a so called Conjoint Analysis. A Conjoint Analysis asks multiple similar questions. Based on the complexity of the issue the number of both the respondents and questions has to be increased. In this research ten questions are used. In a Conjoint question the respondent has the option to choose between three similar products, or to choose none of the products. The products are three different supermarkets defined by the five attributes. When the customers answer multiple questions it enables the researcher to find the relative importance of each of the attributes by measuring the trade off between different supermarket characteristics made by the respondent. The questions were asked as in Figure 2.
Practice
The aim is to be able to predict which customer will use which supermarket. A logit model is the obvious choice to predict the choice of supermarket. A downside of the logit model is that it is based on a discrete choice between two options: the response is either zero or one. When modeling the supermarket choice, first the problem of multiple choices has to be overcome. This can be done by extending the model to a multinominal logit model. In a multinominal logit model the choice between two options is extended to m options as developed by McFadden (1974) [3]. Still, the multinominial logit model does not take into account that a customer can use more than one supermarket. To cover for this, each observation gets the weight according to the percentage spend in the supermarket. For example, if one spends 75% at Albert Heijn and 25% at Jumbo, the observations for Albert Heijn and Jumbo have frequency weights 75 and 25. This results in the following model:
![y_{i,j} = \frac{e^{\sum_{k=1}^5[\beta_{j.k}d_{i,j,k}\bar{u_{i,k}}]+\delta_jX_i}}{\sum_{j=1}^Je^{\sum_{k=1}^5[\beta_{j.k}d_{i,j,k}\bar{u_{i,k}}]+\delta_jX_i}}](https://mlp0wokbivfj.i.optimole.com/w:204/h:38/q:eco/ig:avif/f:best/https://nekst-online.nl/wp-content/ql-cache/quicklatex.com-f68f39902e13f361845cdc268f52aee4_l3.png "Rendered by QuickLaTeX.com")
with
Dependent variable:
 is the probability that respondent
  chooses supermarket
  , and can be interpreted as market share.
Independent variable:
 is the subjective score given by each respondent to each supermarket
  on the
  Customer Relevancy Attribute;
 is a measure for the importance of the Customer Relevancy Attribute for respondent
  ;
; is the vector of personal characteristics, age, gender, education, size household and occupation of respondent
  .
.
Coefficients:
 is a measure for the effect of an increase in subjective score of Customer Relevancy Attribute
  of supermarket on the probability of using supermarket
 is a measure for the effect of a change in personal characteristics of the respondent on the probability of using supermarket .
From the questionnaire all variables are known except for the importance of each of the attributes,  . However, this can be estimated from the Conjoint Analysis. By use of Bayesian Estimation the importance for all levels of all attributes can be estimated. This can be done on an individual level or with a predetermined amount of clusters. Calculating individual levels first and clustering them afterwards gives approximately the same results as direct clustering, where direct clustering leads to smaller standard errors. With the importance determined the multinominal logit model can be estimated. A note, however, is that an estimated value, attribute importance, is used as input for an estimation. Therefore, the input lacks precision and has a confidence interval for itself. Using uncertain values for the estimation makes the standard deviations of the final estimation unreliable.
Results
The Conjoint Analysis showed that five customer segments can clearly be defined. Each segment contains between 14% and 29% of the market and has a focus on either one or two elements from the Customer Relevancy Model. As can be seen in Table 1, the price segment is the largest segment of all. This explains why supermarkets keep trying to compete on price, however it is clear that over 70% of the customers find other aspects of the store more important than the price of the products.
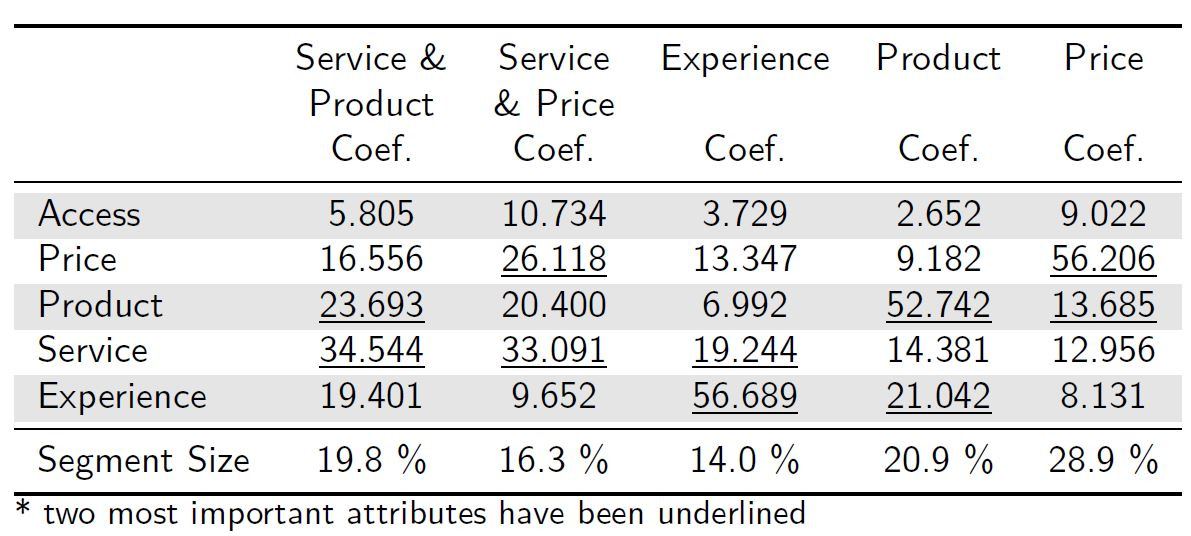
Furthermore, it is remarkable that access does not play a role in the choice of supermarket while every student knows that the closest supermarket is most likely to be chosen. Two reasons can be given for this. Firstly, access is defined as opening times and not how close the store is located to the customer’s home. Secondly, it turns out that when price is removed from the analysis, access appears to play an important role. From this we conclude that price overrules access in the decision process. Access makes even a stronger entrance when Jumbo is compared to Albert Heijn. When the scores of the two supermarkets are compared, Albert Heijn shows a lower rating on price while having only a minor advantages in the other four areas. Yet the market share of Albert Heijn (32%) is larger than Jumbo (19%). The underlying difference is the number of stores. Albert Heijn has over 850 stores and Jumbo around 500. The ratio of stores 58 is almost equal to the market share. So, access is unknowingly an important driver for supermarket choice for many customers.
Next to the importance of the attributes the match between supermarket and customer is made. Each customer has, based on their answers in the Conjoint Analysis part of the survey, a probability of being in each of the customer segments. This way a customer profile can be made for each of the segments. The profile consists of the personal characteristics of the customers within the customer segment. For example, the average customer with a preference for experience has a higher income. As the customers are placed in one of the five segments and the shopping behavior of the customers is known, a match between the customer segments and the supermarket can also be made. This enables us to answer the question: does each supermarket serve a customer segment? The results of the match are compared with the brand promise of each of the supermarkets. From this follows that Aldi and Lidl are competing with each other, as are Jumbo and Albert Heijn. This is not surprising at all, but the results also show that there is almost no competition between high-end stores, Albert Heijn and Jumbo, and low-end stores, Aldi and Lidl.
Conclusion
From the analysis follows that supermarkets have two options: being high-end and perform on access, product, experience and service or become a low-end store and perform on price. Furthermore, the research has shown the potential of datadriven decisions in the retail market. When the research is extended to include more customers and more supermarket attributes, it can be used to simulate the market conditions and predict customers’ choice of supermarket.
References
[1] Michael Levy and Barton A. Weitz and Dhruv Grewal. “Retailing Management”, 9, McGraw-Hill International Edition, 2014
[2] Avijit Ghosh “Retail Management”, 1, The Dryden Press, 1990
[3] Daniel McFadden, “Conditional Logit Analysis of Qualitative Choice Behavior”, Frontiers in Econometrics, 1974, 105-142
[4] http://www.nu.nl/vd/4190872/warenhuisketen-vd-faillietverklaard.html, accessed on February 21, 2016
[5] http://www.nu.nl/ondernemen/4034896/miss-etam-faillietverklaard.html, accessed on February 21, 2016
[6] http://www.nu.nl/economie/4218917/moederbedrijf-perrysport-en-aktiesport-krijgt-uitstel-van-betaling.html, accessed on February 22, 2016
[7] http://www.distrifood.nl/formules/nieuws/2014/12/albertheijn-voert-in-stilte-prijzenoorlog-10122364, accessed on July 9, 2015
Text by: Martijn Heinen


