
Optimizing the Personalized Product Recommendations within E-Commerce
During my Master thesis, I was given the assignment to create a model which recommends the best fitting products to an individual customer. At the start of the thesis, I was provided with a paper [1], which mainly included text mining models. Although this might seem a strange model to predict the best fitting products to a customer, there are actually many similarities between a piece of text and the shopping history on a website. Therefore, I was very excited to start my thesis and to try and find the optimal fit for every customer.
Writen by Jeffrey Buijk
Predicting the next word in a sentence
In order to start the assignment of predicting the optimal prod-ucts for a customer, my thesis started with a model [2] that predicts which words are close to each other, based on multi-ple text files. The idea behind this model is that words which are close to each other within the same text, are likely to be connected with each other. On the other side, words which do not appear close to each other are considered to be different from each other. In this model, we want to create pairs of words which have positive value between each other and pairs of words which have a negative value. This has been done by defining center words that get assigned a positive word, which is close to this word in the text, and multiple negative words. These positive word combinations are created by picking a word in a text and choosing n words before and after this word.
Take for example the sentence ’The Nekst is a quarterly mag-azine, which belongs to Asset Econometrics.’ When we want to describe the word ’magazine’ in this sentence and choose n = 4, then the words ’Nekst’, ’is’, ’a’, ’quarterly’, ’which’, ’belongs’, ’to’ and ’Asset’ all form a positive context pair with the word ’magazine’. These context pairs are now filled with negative words from the remainder of the text, that are sam-pled based on the following probability:  . In this probability function
  describes the amount of times a word is used within the text. This means that words that appear often in the text are more likely to receive a negative pairing. This is mainly useful to avoid that common words, such as ’is’ and ’the’ are too often considered as posi-tive words. The power
  is used to scale the probabilities of common word. That is, when
  all words would be treated equally and when
  , words that are used often are punished very badly. Finally, we also have the constant Z that is used to make sure that the probabilities of all words sum up to 1.
When we take the previous sentence, which is written within a practical report, as an example, we could have a context pair-ing for the word ’magazine’ that has ’Nekst’ as its positive pairing and ’shopping’, ’the’, and ’zoos’ as its negative word pairings. When we sum over all different context pairings  in the text, with center word
  , positive pairing
  and negative pairings
  , we can apply formula (1), which maximizes the probability of positive words appearing together and minimizes the probability of negative words appearing together.

From formula (1), we now have two di˙erent matrices, namely center matrix  and context matrix
  . In these matrices,
  are the amount of words in the text file, while
  is equal to the amount of latent dimensions we use in our model. Within a latent dimension, the characteristics of the word are described. For example, the first latent dimension could be describing whether words are nouns. In this case, words that are nouns can all have a high value for this latent dimension, while words that are not nouns should have a low value. By calculating
  , we get a
  matrix in which words that are likely to appear next to each other in the same text have a high value, while words that are not likely to appear together have a low value.
Applying a text mining model to predict e-commerce data
Now that we have predicted which words occur often together in the same sentence, the question arises how this can be used to predict which product a customer is most likely to purchase. As described by Gabel, Guhl, and Klapper [1], we could treat the shopping history on a website in a similar way as the words in a text. Within this shopping history, we have di˙erent cus-tomers that have purchased one or multiple products. When we compare this situation with the text file we have described before, we can therefore compare the shopping history with the text and the different customers as sentences within this text.
Where we before created a positive context pairing when words were close to each other in the same text, we can now create this positive context pairing for products that have been purchased by the same customer. When we assume that a customer purchases a product for its own benefit and not as a present for someone else, we can argue that products purchased by the same customer are likely to be purchased by a similar type of customer as well. To give an example, we can think of a sports clothing shop in which one customer purchases football boots and shin pads while another customer has purchased a tennis racket and a headband. When a new customer comes in and is looking at football boots, we are more likely to recommend this customers shin pads than we would recommend a new tennis racket. By creating positive and negative context pairing in a similar way as for the text mining model and by replacing words with products  in formula (1), we can now create
  matrices
  and
and  , containing the likelihood for every product pairing to be purchased by the same customer.
But, the diverence between predicting the next word within a text file and predicting the next purchase of a customer, is that most customers have already purchased multiple products. This does, however, mean that we now need to know which product is most likely to be purchased next for a group of products. In order to cope with this problem, we can use the Skip-Gram model, which is described by Rong [3]. The idea behind the Skip-Gram model, which is illustrated in Figure 1, is that we create for every product which has been purchased by this customer  a vector
  which is 1 for product and 0 for all other products. This vector
  will now be multiplied with center product matrix , resulting in a
  hidden layer vector
  . After this hidden layer vector has been calculated, we will multiply it with the context matrix , resulting into an output vector
  , in which similar products to the input product have a high value. Now, we want to calculate this output vector for every product in the input of this customer , resulting in vectors
  in case this customer has purchased
  products. Finally, we can now calculate the output vector
  for customer using formula (2), where
  is the purchase history of customer .

The products with the highest values in are the products that will be recommended to this customer.

Applying a clustering algorithm to discover which products are similar to each other
Up until now we have discussed a model that can be used to recommend products to a customer, based on their purchase history. Although this will of course be useful for customers that are familiar with the website, we also have to take into account that there will be new customers that are visiting a website for the first time, from which we now have information about. For these customers we can not make any reasonable recommendations, but we can create recommendations which are attached to other products. This way, when a customer would select a certain product, we can easily recommend ad-ditional products, which are linked to this product.
When we want to recommend multiple products based on one product page which has been visited, a clustering algorithm can be applied. By clustering the di˙erent products that are sold on this website, we can determine which products have similar characteristics to each other and therefore are more likely to be either substitutes or complements to this product. A clustering algorithm that is fitting for these circumstance is the t-Distributed Stochastic Neighbor Embedding Algorithm [4] or shortly abbreviated t-SNE. When we want to analyze a product, this product can have multiple different layers con-taining information about this product. When we take for example a carton of milk, certain characteristics we can al-ready determine from this product are the fact that this is a drink, the color is white, it is packaged in a carton, and it is a dairy product. Next to these factual observations, we can also have observations like: the products are mainly purchased by female customers, customers who are around 30 years old, and customers who are shopping in the morning. Every prod-uct can therefore have many different layers of information, which makes it diÿcult to compare it with di˙erent products. A characteristic of the t-SNE clustering, is that when using it, we can visualize high-dimensional data into a two or three dimensional map, which makes it easier to compare products with each other.
In our model, we can apply t-SNE clustering on the center matrix , which has layers of information about every product. By summarizing these layers of information into a center matrix  containing two layers, we can more easily compare the similarities of products, which makes it also possible to visualize the products in one graph. Without going to much into the mathematical details, t-SNE aims to create proportional probabilities using a Euclidean distance function. When we have
  different products, this means that we can create different vectors:
  containing the different layers for every product. For these different vectors, we can calculate the Euclidean distance
  between every pair of product vectors. When we apply t-SNE clustering, the Euclidean distance of the two-dimensional vectors is proportional to the original vectors.
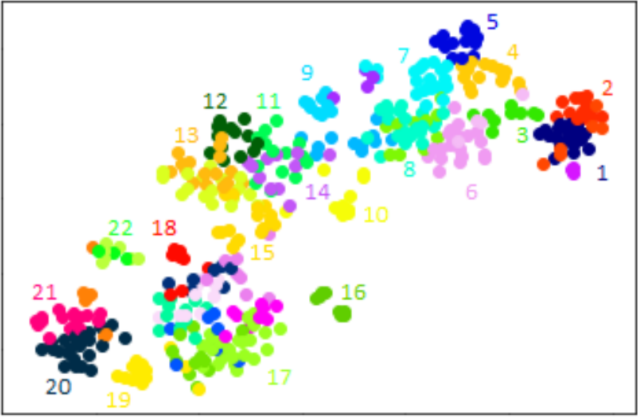
Based on the data that has been used during the thesis, it is possible to see what the results of this t-SNE clustering are. In Figure 2, we can see the illustration of 450 different products that are sold on a certain website within e-commerce. In this picture, we can see approximately twenty different product groups based on the data. In the top right of this picture, we can see different types of days-out. We can see for example that group 1 mainly contains theme parks focused on younger children, group 3 contains theme parks outside of the Netherlands, and group 7 contains theme parks within the Netherlands. Group 2, 4, and 5 all contain tickets to different zoos, which are spread over different locations of the Netherlands. On the other side of the picture, we can see different types of textile products, which appear to be the total opposites of day-out tickets. In group 20, we recognize different types of bed linen, while in group 21 we can recognize towels and washcloths.
Internship
I did my research on this topic during an internship at SphereMall. During this internship, I was given the opportunity to work with data of a client within e-commerce who sells many di˙erent types of products to their customers. The value that SphereMall mainly wants to provide to their clients is an analysis of how customers are behaving on their websites and extend this with models which can guide these customers more easily towards finding the product they are looking for.
References
[1] Gabel, S., Guhl, D. Klapper, D. (2019), “P2V-MAP: Mapping Market Structures for Large Retail Assortments.” Journal of Marketing Research, 56(4), 557–580.
[2] Mikolov, T., Sutskever, I., Chen, K., Corrado, G. and Dean, J. (2013), “Distributed Representations of Words and Phrases and their Composionality.” In NIPS.
[3] Rong, X. (2014), “Word2vec Parameter Learning Explained.” arXiv preprint arXiv:1411.2738, 2014.
[4] Van der Maaten, L. (2014), “Accelerating t-SNE using Tree-Based Algorithms.” Journal of Machine Learning Research, 15, 3221 – 3245.