The Optimal Wine Adventure
Wine or Beer tonight? This question is asked more frequently in our student society than we care to admit. The myth that in a Van Dale dictionary, it was once mentioned that students can never officially be alcoholics, is sadly not true. We are very sorry to ruin your feel-good excuse, but we are also happy to announce a replacement that you will still be able to use even after your student time. It all starts with the right reply: wine of course!
Written by Tamara Dert and Maureen Lacet
That wine makes people feel more sophisticated is a well-known fact, but in a sense, this turns out to actually be true according to Gordon M. Shepherd, Professor of Neuroscience at Yale School of Medicine. “Wine tasting involves multiple sensory and motor systems, as well as central conceptual systems for cognition and memory – and systems for emotion and pleasure”, Shepherd says. This is why the brain becomes more stimulated whilst tasting wine than it would, for example, when listening to music or even solving complex math problems, which involve fewer body systems working together. Talking about complex math problems, we still like those and as you know, they can be used everywhere to make life better. Drinking wine for instance, with all of those different sensory systems, is a lot more enjoyable if you have a wine in your hand that you actually like. So, put your beer aside and let’s have a look at what you should be drinking.
Predict the wine
When going to the supermarket, it is overwhelming how many bottles there are to choose from. The etiquette can indicate the grape, the region, or sometimes just the chateau. Let’s be honest, it is a jungle. So it is time to take a step back to the main question: how can a wine unambiguously be described? Wine has several chemical measures; acidity, volatile acidity, citric acid, residual sugar, chlorides, free sulfur dioxide, total sulfur dioxide, density, pH, sulfates, and alcohol. There is a data set available consisting of red or white wines and their chemical compounds from the Vinho Verde region in Portugal. This data set also contains the variable quality. However, quality is a subjective variable. The rating is on a scale from 1 to 10 and is based on at least three evaluations from wine experts (what a job!). Since all of the wines in the data set are from the same region in Portugal, we need to keep in mind that the data will not generalize to every wine. How can these wines be connected to math? The following complies with the lines of the article: wine & math, a model pairing by Lars Verspohl.
A linear model could reduce relationships between individual data columns to an equation, for example:
Alcohol * Alcohol Weight + Acid * Acid Weight + Sugar * Sugar Weight = Quality (likelihood to be good).
This is, of course, a very simple example. But, it shows that it is possible! The inputs are weighted by a factor that tells the model how much impact the attribute has on the output.
The next question is then, how to determine these weights? We cannot just say: well, let’s put more weight on Alcohol, because I like alcohol. No, here is where machine learning is necessary. We need to teach our predictive model how to learn from the data.
We have a training set that contains all the model inputs and the model output variable and we train our model on this data. This means that we give our model this training set and label what we want our model to learn, in our case the quality of the wines. Then, we let our model detect patterns that help conclude our classification into high- (rating 7 or above) and low-quality wines (rating below 7). Next, we want to check how well our model performs on new data: our test data. We let the model predict the output variable based on the inputs and compare the accuracy of this prediction. If our model is accurate enough, then we can use our model to predict the quality of future wines based on these chemical measures. This process is called supervised learning and is basically learning by example for computers.
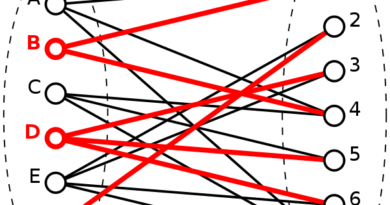
Next, we need to look at our data. The data set on the red wines contains 1600 wines and their chemical properties and quality. We are mainly interested in how the physicochemical properties relate to each other and specifically how they relate to quality; we want to classify the wines into high- or low-quality wines (see Figure 1).

An interesting attribute to look at is, of course, alcohol (see Figure 2). Higher quality wines are likely to have more alcohol in this data set.

Next, we want to look if a model can be built that represents the relationship between the variables and quality. To start simple, we only look at an Ordinary Least Squares (OLS) model (see Figure 3) that predicts wine quality only on Alcohol. We would then get the following equation:
y =a*x + b
y: quality output value
x: alcohol input value
b: intercept
a: slope of the line (by how much quality goes up if we add one percent of alcohol, ceteris paribus)

This is way too simple for our distribution, and the line can result in alcohol percentages corresponding to negative qualities, which is not possible. Therefore we do not want a model with a straight line, but we can look at, for example, a logistic regression (see Figure 4). For this, we simplify our data to a binary variable: 0 for low quality, 1 for high quality. A logistic regression expresses the relation between alcohol and quality in probabilities. For example, if a wine has an alcohol level of 12, it has an 86% probability of being good.

To make our full model, we need to include all predictors and not only alcohol. So far, we have used linear models that model correlation. However, we might be interested in non-linear relations too. For this, we need nonlinear models. Model selection is therefore very important and depends on what you are interested in. We could apply Random Forests to see which variables are more important in predicting quality. Principal Component Analysis can be implemented to see which variables explain most of the variation in the data set. But other machine learning techniques can be applied as well: think of Support Vector Machines or Neural Networks.
The eighteen-year wine plan
With the regression model, just discussed, we could theoretically predict what a wine we have not yet opened will be like and which chemical compositions lead to good wines. Both are interesting, but wine has to be drunk at the right time to really live up to its potential. How to know when a wine is at its best is a well-researched subject (such as Gonen, Tavor, and Spiegel (2021), I (Tamara) personally make use of vintage charts). If you are in the mood for a rosé wine, then you are in luck. Rosés should not be drunk ‘old’ and are therefore often not that expensive. However, if you want a high-quality Bordeaux like from Chateau Pavie- St. Emilion (2001) at its peak, you will find some difficulty. You have to cough up around 300 euros a bottle… If you do not have that money flying around, do not worry. With a bit of coordination and math, you can feel extravagant for a small price tag. Just last month, I bought a bottle of Bordeaux for eleven euros, also from Chateau Pavie – St. Emilion with, according to wine experts, the same potential (both a 95 rating). The only difference is the year. My bottle is from 2014 which means that it will take another ten to fifteen years before it attains the same perfect state of maturity.
By now, you have all guessed the solution: buy a ‘young’ wine, drink an ‘old’ one. So what does a perfectly balanced stash look like? If we want to keep drinking and having bottles at their peak of all ages, we get something looking like an ideal complex situation. We drink the old well-aged bottles (if newly bought, they are quite expensive) and buy just as many young, cheaper bottles. However, unlike the most simple ideal complex situation, we want to drink different wines with different ageable characteristics. To deal with this issue you have to proportionally buy and drink wines of different rates of maturity. You could, for instance, decide on a continuous six-tier system of three years in which you drink and consume 20 bottles a year (see Figure 5). You then need to buy nine bottles to drink in the first three years, five to be finished in four to six years, four bottles to be consumed in seven to nine years, one bottle to be opened in nine to twelve years, and one to save up till twelve to fifteen years. This way you constantly buy at a cheap price and throughout time, you will have a regular assortment of aged wine on hand.

Figure 5: minimum inventory level model, 3-year continues on in perpetuity (space needed for at least 133 bottles) (source) .
Note 1: here at the start, a number of available bottles is assumed, this is not necessary for the process, but it does speed up the process of having wine ready at all maturities.
Note 2: the bottleneck factor for this to work is that New Purchases proportionally have the right ageable qualities. Respectively 43% 1-5Y, 25% 6-10Y, 17% 10-15Y, 8% 16-20Y, 4% 21-25Y and 4% 25-30Y.
Cheap Personalized Taste
Hopefully, you have been inspired. There is, however, a bit of a catch. It is doubtful that everyone has space for 133 wine bottles, agrees with the subjective term ‘quality’, and has the patience to wait eighteen years. Therefore, we would like to propose a third option: starting your own database (we all know that you like spreadsheets). When doing it right, you could create your own data set with details (of your choice) of the wines you have tasted within your price and patience range. Add your own opinion under ‘quality’ and you can regress your own taste. OLS might be too simple, but try another machine learning technique instead. This way you can find out exactly which wine characteristics you prefer (and which not). Then take into account that 90 percent of all wines are already at their best within the first year. You will find that there are a lot of different ‘flavors’ to explore without having to keep a huge wine cellar. The wines of this category are often a bit more straightforward and cheaper white and red wines for which, it is useless to preserve them in hope of some great tertiary aroma. They are not all good nor all bad. You could describe them as a bit harsher, so you just have to find the ones you like. Do not forget: for the results to be statistically significant you have to taste quite a lot of wine, so let’s go! And keep in mind: they might not all be superb but at least it stimulates your brain.